The main reason I got into cycling was that it was simply the best way for me to get to school. As I grew up I discovered that it was also the best way of getting around Hinckley, Central London, the villages of southern Cheshire, Milton Keynes, Georgetown (Guyana), and of course, Cambridge (England). I was never bothered about how much fat I burned, or even that I was saving the planet along the way (apparently). For me it has always been the 'obvious' way to get around the place I live.
But other people are interested in these things, and now that I've added them to the journey planner calculations, I'm getting more interested in them too.

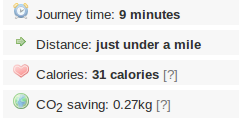
The 'calories burned by cycling' calculation was added to a customised cycle journey planner for West Sussex County Council a few months ago. They have enjoyed a period of exclusivity with that, but we are now making that calculation available to all. The calculation takes into account the speed of cycling and any hills going up or down, but ignores any head or tail winds. It assumes a rather typical roadster bike aerodynamic, and a combined rider and bike weight of 90kg. The full calculation is explained on the help pages.
The Carbon Dioxide (CO2) saved figure has been included in our route listings for over a year now. It was part of a series of improvements to our site covered by a Sustainable City grant from Cambridge City Council in 2010. The calculation is explained on the help pages.
The amount of energy used in riding the route, and the amount of CO2 saved compared to an equivalent car journey are now also included in our API so that future versions of our mobile applications can use them too.
We hope this extra information adds to your enjoyment of the site and perhaps helps you more appreciate some of the physics of cycling.
2 thoughts to “Calories burned and CO2 saved”
Pingback: CycleStreets » Blog
Pingback: CycleStreets » Blog