We’re really pleased to announce that we’ve been selected for the Outlandish Fellowship to help local cycle campaigners by expanding our collisions data pages into a broader resource covering more types of data (e.g. traffic counts, pollution) and add lots of new ways to access it.
Helping campaigners campaign
 Getting more people cycling brings a more sustainable and efficient transport system, improved public health, and greater access to employment. However, in the UK, cities have failed to make space for cycling on our streets, preventing mass uptake.
We know from our own activity as campaigners in Cambridge, that making a good evidence-base for reallocating roadspace or challenging poor developments involves significant work. For instance, developers often claim that their route has “good connections to the local cycle network” whereas in practice we know that this often means a shared-use path that is hard to access.
We lack the data to make a strong case that, for instance, a combination of a high collision rate, congestion, pollution in an area means that a developer or a Local Authority needs to improve their plans. Of course there remains the need for making arguments based on broader policy, such as that cycling should be prioritised as a positive and healthy form of transport, but hard data for specific cases helps backs this up.
What kind of data is out there?
There’s lots out there that could be useful for cycle campaigning. Things like collision data (which we’ve already done a bit of work on), traffic count data, travel time data, census travel data, on-street counts, etc. Imagine if, instead of having to search these out and find someone technical to process it, you could simply point and click, with national coverage?
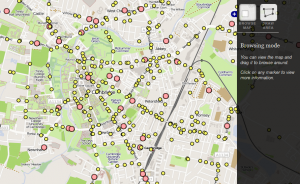
This data is becoming available but it’s very scattered, meaning that correlations are hard to make. It’s often in raw formats that need significant work before it can be understood, or hidden in Local Authority websites that are not sufficiently flexible or easy for non-specialists to use. Often it’s not arranged for the kinds of tasks that cycle campaigners specifically need.
We’re aiming over time to build up a multifunctional resource to help build this case, enabling users to a build and link to an interactive display of the relevant data (involving multiple layers, clickable points, reports, summary info) for a particular location or route, that they can use in their advocacy and liaison work.
Mark, better known as ‘Ranty Highwayman’ in cycle planning circles, said:
“The project looks really exciting. From my point of view, the ability to generate information from one place is a great idea as at the moment, it’s a really labour-intensive process, this could create maps for reports, committee papers etc.”
Our plan is that it would be available for embedding in local campaign websites, exporting to reports, used in apps, and so on.
Some examples
Here are just a few sample stories that we’ve come across in our own work as cycle campaigners, some from Cambridge:
- Justification of removal of one-way street restrictions for cycling. In previous decades, traffic planning favoured one-way streets as a way to regularise traffic flows and avoid rat-running. However, the side-effect is to stop easy cycling. If we could compare collision data easily in a particular location, we could show how streets that have been made two-way for cycling haven’t caused a safety hazard.
- Worsened likelihood of collisions in areas with an existing poor record. A supermarket developer wanted to open a local store under a just-in-time delivery regime in a high street with a narrow carriageway that has heavy traffic and high pedestrian and cycle flows. A good evidence base, combining flow level data, Origin/Destination data, collisions and traffic data delay data, would have enabled us to argue that the developer will need to amend their delivery plans to be more sympathetic to the local circumstances.
- Higher levels of pollution in areas with significant problems already. Areas with many schools particularly need to avoid pollution. A developer proposes a new estate in such an area but fails to provide good connections into the site for walking and cycling. A better evidence base, combining socio-economic data, school travel data, pollution and cycling levels would help us convince the Local Authority that the developer needs to provide this connectivity.
What changes can people expect?
We’ve started from our collision data viewer as the base, and to this we’re adding:
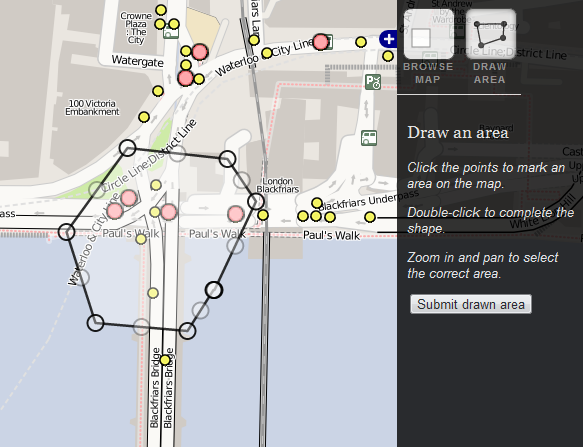
- Completely reworking the search facility so that it’s actually useful – currently it’s stuck in a prototyped state, with lots of non-useful fields. This will mean that common scenarios like “Collisions between a date range in area X” are possible.
- Adding typical scenarios as new front-end ways to access it. Currently, it’s very map-based, whereas we want to enable common use-cases much more easily.
- Making everything Local Authority -aware. Currently it’s all manual boundaries, but we’d like users to be able to do things like compare casualty rates (and other data – see below) between areas.
- Upgrading the interface. We’ve now got some nice new icons for a start :)
- Adding a better way to import the data. Currently, updating it each year is not as easy as we’d like, and new data types (see below) need to be supported.
- Adding generalised origin-destination data for areas, using analysis from our own journey planner
- Adding traffic count data, from the DfT
- More data (in future – after the current Fellowship work)
- Adding the ability to switch between multiple layers of data
- Making all the above available through a more generalised Advocacy data API. In fact, this will be the system powering all the above!
- Adding the ability to embed custom views of the data in other sites
The code will be open source too :)
We’ll be giving updates via this blog over the coming 6 weeks – stay tuned!
Blackfriars Bridge, scene of many unfortunate collisions over many years. With the new data platform, it will be possible to make easy comparisons about how the introduction of the new Dutch-standard cycle infrastructure just built reduces these collisions.
Outlandish
 Outlandish is a web agency based in Finsbury Park, down the train from us in Cambridge. The members of Outlandish want to unleash technology’s potential to make the world a fairer, better place. It’s a worker co-operative and invests all surpluses into projects that help achieve the members’ goals. They build digital applications and websites for companies, charities and universities that make their lives easier and help them to discover and communicate new insights from their data.
Outlandish has made available fellowships for people who are using the Internet and digital technologies to address social issues. The fellowships include funding and other forms of support to allow participants to start their own projects. The aim of the fellowship is to support work that matches the mission of Outlandish, and to expand the network of people that they actively collaborate with.
We’re really proud to be in the first set of Fellows, and it’s going to be great to be working with a co-op!


Photos from the launch of the Outlandish Fellowhip
Our project team
Our main developer on this project is Martin, doing most of the work, as the Outlandish Fellow.
He’s being helped by Simon (CycleStreets’ other principal developer), when he can be wrestled away from interesting routing quality challenges like turn delays that we’ve been working on recently.
We’ve also set up a Stakeholder board, to ensure that the data work we’re doing is genuinely useful. This is:
- Katja Leyendecker, NewCycling (Newcastle)
- Robin Lovelace, Leeds, providing a perspective from the needs of academia
- Roxanne de Beaux, on behalf of Cambridge Cycling Campaign
- Jonathan Fingland, Cyclenation and Greater Manchester
- Tom Guha, Space for Cycling Officer, Cycling UK
- Bez, of Beyond the Kerb
- Mark ‘Ranty Highwayman’, as a professional in the transport planning industry
A version of this blog post also appears on the Outlandish blog.
One thought to “Making data more usable by campaigners: our Outlandish Fellowship”
Thanks – this will be se useful